Trading Terminology 101
From big squeezes to diamond hands, learn about the trading slang and terminology that every trader needs to know.
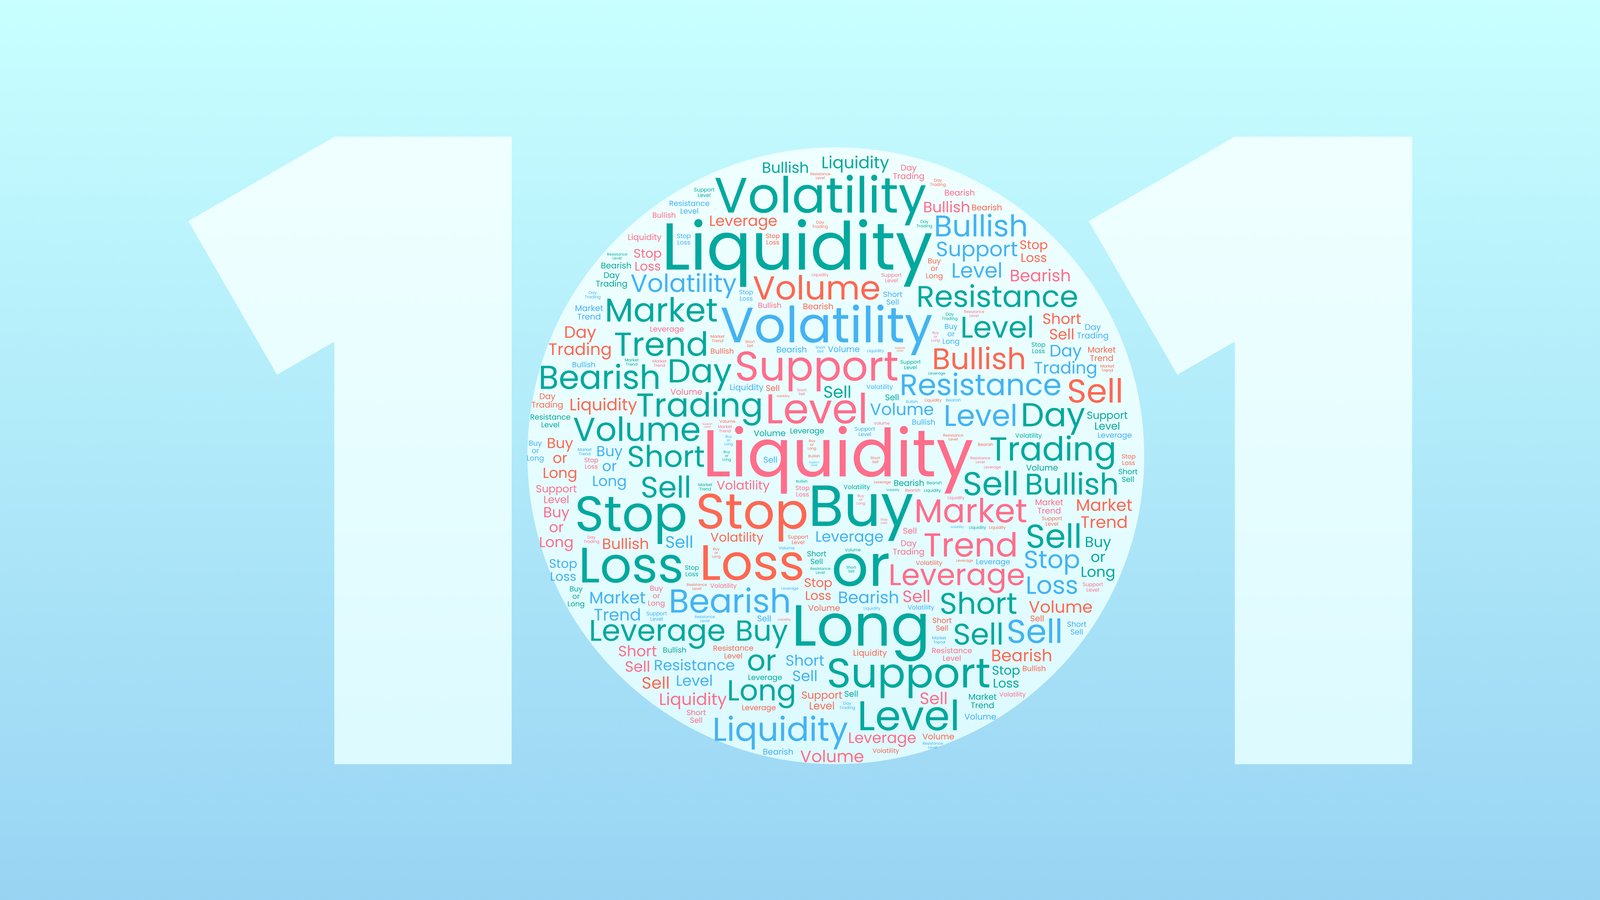
Trading involves a lot of unique terminology and financial slang that might seem strange at first, but it’s important for beginners to understand the right terms to be able to read markets faster
Knowing basic trading terms will help you to understand prices, to navigate trading platforms easier and to avoid mistakes when opening a trade
Specific terms are used to describe market sentiment and behaviour, while technical analysis also has its own terminology
Trading slang is often used by industry professional in the news and on social media, so its important to understand the references so that you can act on events faster
Common trading terms
If you're new to trading, you’ll see and hear words that may sound unfamiliar. Trading has its own unique vocabulary, and knowing what some of these words mean will help you navigate the markets and better avoid uncertainty.
Let’s first look at some words that online traders use on daily basis:
Long: In trading, to “go long” means you are buying an asset that you think will increase in price, with the intent that you will sell it later for profit. This is also described as “going long” or “taking a long position”, but it does not mean you need to keep the asset in your portfolio for a long time.
Short: “Going short” means you are selling an asset that you don’t own directly through a secondary market contract such as a CFD, this is done with the intention that it can be bought back at a lower price in the future. You may also see this strategy described as “short selling”. A “big short” or “big squeeze” is when market sentiment triggers a large sell-off of assets at the same time, causing the asset’s price to drop radically. If you go short, your profit or loss will be calculated as the difference between the price in which the asset was sold and the price at which it was bought back, minus any borrowing fees or interest paid.
Leverage: Leverage describes using borrowed funds to increase the size of your position, which magnifies its potential for gains and losses. This means you can deposit a fraction of the trade size you would like to control by using funds provided by a third-party, such as your broker or liquidity provider. For example, if the leverage is 1:20 investing $100 dollars allows you to place a trade worth of $2,000.
Lots: In forex trading, a currency pair is traded in lots. A lot is 100,000 units of the base currency in a currency pair. The base currency is the first currency shown in a currency pair quotation. For example, for a USDGBP pair, it would be US$100,000, and for GBPUSD, it would be £100,000. Lots are important because they determine the size of a trade and the amount of profit or loss a trader can make.
Pips: Pips are the smallest price changes in the forex market, used to measure changes in currency pairs. For example, if the EUR/USD currency pair moves from 1.1000 to 1.1050, it has moved 50 pips.
Spread: Usually, the spread is the price difference between the bid price (the amount traders are willing to buy it for) and the ask price (the amount traders are willing to sell it for) of a product, like a forex pair or share. This is called the bid-ask spread. It represents the cost of trading and can vary depending on market conditions and liquidity, and the spread in forex is the difference between the buy and the sell price in pips. You can calculate this by subtracting the bid price from the ask price. For example, if you're trading GBPUSD at 1.3090/1.3095, the spread is calculated as 1.3095 minus 1.3090, which is 0.0005 – or, 5 pips. A zero spread (sometimes written as 0.0 pips) describes when there is no difference in pips between the bid price and ask price; they are exactly the same price when the spread is 0. Highly liquid markets tend to have a tighter spread.
Stop loss and take profit orders: Stop loss and take profit orders are popular risk management tools which allow traders to place a trade that will automatically close out when it reaches a certain price point. These are used to improve chances of reduced loss and to lock-in potential profits. A stop loss order works by automatically selling your chosen asset if it reaches a certain price level to limit losses, while a take profit order is placed to automatically sell if it reaches a certain price level to secure profits.
Technical analysis terminology
Technical analysis is a popular practice in trading that involves analysing charts and past and current price data to identify patterns, trends, and potential trading opportunities.
Here are some commonly used terms that you might find in technical analysis:
Candlesticks: Candlesticks are graphical representations of price movements on a chart over a period of time, mostly used in technical analysis. They display the opening, closing, high, and low prices of a tradable product and give insights into market sentiment and trend direction. Trading candlesticks are composed of two parts, the body and the wick. The body is the rectangular part and represents the opening and closing prices. If the closing price is higher than the opening, the candlestick is typically coloured green to show a bullish trend. If the closing price is lower, the candlestick is hollow, black or red to signify a bearish movement. The wick is a thin line that extends above and below the body, and this indicates volatility as it shows the highest and lowest price reached during the time period. The patterns created by candlesticks, such as Doji, Hammer, Shooting Star and Engulfing, can also be used to predict future price movements.
Trendline: Trendlines are lines that connect series of prices on a chart. It’s drawn by connecting either highs or lows or both to create a price channel. Trendlines are used by traders to predict which direction an asset’s price will move in the future.
Support and resistance levels: Support and resistance levels are price levels that an asset has historically struggled to move below (support) or above (resistance). If there are recurring price levels in its price history, traders might see them as potential entry and exit points for future trades.
Moving average: A moving average is a popular tool in technical analysis that smooths out price data by creating a constantly updated average price over a specific period. Moving averages can be used to identify trends and potential trading opportunities.
Fibonacci retracement: A Fibonacci retracement is a technical analysis tool used to find potential support and resistance levels within a price movement based on the Fibonacci sequence, which is a mathematical sequence that shows each number as the sum of its two predecessors (i.e., 0, 1, 1, 2, 3, 5, 8, 13, and so on). Traders use Fibonacci retracements to identify potential entry and exit points for trades, as they can help predict where an asset’s price might reverse or consolidate during a trend.
Big squeeze: The term "big squeeze" is often used interchangeably with "short squeeze." A big squeeze occurs when a significant of traders the price of an asset that has been heavily shorted experiences a rapid and significant increase, leading short sellers to buy the asset to cover their positions. This surge in buying activity can lead to a snowball effect, pushing the price even higher.
Market behaviour and sentiment phrases
Understanding market sentiment and how markets or traders behave is vital for making more informed decisions in trading. There are specific terms that traders use to describe different market conditions and sentiments, as well as the actions traders take in the markets.
Here are some examples:
Bull and Bear: These popular terms are used to describe the overall market sentiment, the mood of investors and the general price direction of an asset. Sometimes referred to as ‘bullish’, a bull market refers to rising prices with optimistic sentiment among traders. A bear market, sometimes referred to as bearish, means assets are declining in price with pessimistic market sentiment and popularity among short-selling traders.
FOMO and FUD: FOMO stands for ‘fear of missing out’ and reflects the anxiety or feeling of urgency that traders can experience when they see other traders profiting and don't want to miss out. FUD stands for ‘fear, uncertainty, and doubt’ and reflects negative sentiments or rumours that can create panic or uncertainty in the market. Making mistakes out of fear can be avoided by keeping a trading journal, following a strict plan, always using multiple forms of analysis and disciplining your mindset.
Flight to safety: Flight to safety describes a situation where traders or investors move their investments from riskier assets to safer assets during times of uncertainty or market turbulence. Safe-haven assets such as gold, US Treasury bonds, or typically more stable currencies such as the Japanese yen are often sought during uncertain times, but it’s important to note that no markets can offer a 100% guarantee of profits.
Panic selling: Panic selling is when traders or investors sell their positions rapidly due to emotion, often fear or panic, resulting in a sharp decline in prices.
HODL: HODL is a whimsical term that stands for ‘hold on for dear life’. It’s used to describe a strategy of holding onto an asset or investment for the long term, despite short-term price fluctuations, with the hope that markets will revert to a more favourable direction over time. The term is often used in cryptocurrency trading which experiences high levels of volatility.
Tanking: Tanking refers to a situation when an asset is suddenly performing poorly, which is usually when the price falls sharply in a short time. The term can also be used to describe the performance of a whole sector or a portfolio. If an asset is ‘in the tank’, it means that its performance has been disappointing for a longer period of time.
Market correction: A market correction describes a temporary reversal in the market trend, usually caused by economic or political factors. Market corrections can be positive or negative, and they’re usually short-term events and might not signal a significant change in market sentiment.
Dead cat bounce: In trading, a ‘dead cat bounce’ refers to a short-term, temporary recovery in the price of an asset or market after a significant decline. The term implies that the recovery is unlikely to be permanent, and the price will eventually go into decline again. Interestingly, the thought behind this term is that even a dead cat will bounce if it falls from a great height, but that doesn't mean it's alive.
Black swan event: A black swan event is a term used to describe an unpredictable and significant event that can cause a massive shift in market sentiment, such as a natural disaster or sudden political upheaval. Black swan events are rare but can have a big impact on the financial markets, leading to volatility and uncertainty. Popularised by Nassim Nicholas Taleb’s book, “The Black Swan: The Impact of the Highly Improbable”, the idea behind a black swan event is based on people believing that all swans were white until they encountered black swans in Australia, and similarly, financial systems and models may often fail to account for truly rare and unexpected events.
Other words you might see
In addition to all the words already covered in this article, here are a few more commonly-used trading slang words that you may come across. These terms are used to describe companies and different investor types.
Blue chip: Blue chip refers to a publicly-traded company that is well-established and financially stable. Blue chip companies usually have strong brand and widely known products. Blue chip stocks are often seen as a safe investment, but the potential return is often smaller compared to more volatile assets.
Unicorn: A unicorn is a privately held start-up company with a valuation of $1 billion or more. The term was coined by Aileen Lee, the founder of a Palo Alto–based venture capital fund, who wrote an article about 21st-century tech start-ups and the fact that that less than 1% of them had reached billion-dollar valuations. Some well-known Unicorns are Airbnb and Bytedance, globally known for its social media app, TikTok.
Whales: Whales are traders or investors who have a large amount of capital and can potentially influence the market with their large trades. They’re often closely watched by other traders for their market moves.
Paper hands: Paper hands is a term used to describe traders who sell their assets too early because they are afraid of the risks involved in holding the position open longer. Usually, traders with paper hands close their position as soon as there is unfavourable price movement or sense of fear or panic in the market.
Diamond hands: Often used in contrast to ‘paper hands’, diamond hands refers to when a trader’s resolve is so steadfast that they won’t let go of their investment even in the face of adversity. They are considered resilient and committed to the long term potential of their investment, and are willing to weather short-term price fluctuations to get to their ideal end result.


