The trend is your friend
Read our beginners’ guide to the trend trading strategy and learn how to use it to maximise your trading potential.

In financial markets, a trend refers to the general direction of the market - which can be upward, downward or sideways
Trend trading is a trading strategy that tries to profit from the current trend by opening long positions in an uptrend and short positions in a downtrend
Traders use several tools, such as trendlines, chart patterns and technical indicators, to identify trends and measure their strength
Learning how to identify and trade trends is a useful skill, as trend trading can be applied to short, intermediate and long term trading strategies and can be used in all markets, such as stocks, commodities and currency pairs
What does 'trend' mean in trading?
Trends are an essential concept in technical analysis and online trading. The simplest explanation is that a trend is the general direction of the market and it refers to the price movement of a financial asset, such as a currency pair, share, commodity, or index.
Trends can occur over various timeframes, ranging from minutes in intraday trading to months or even years in long-term investing.
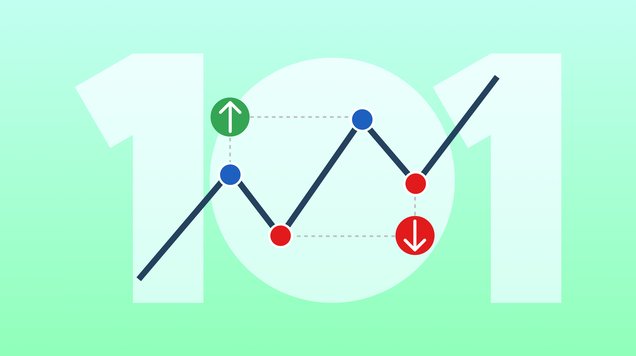
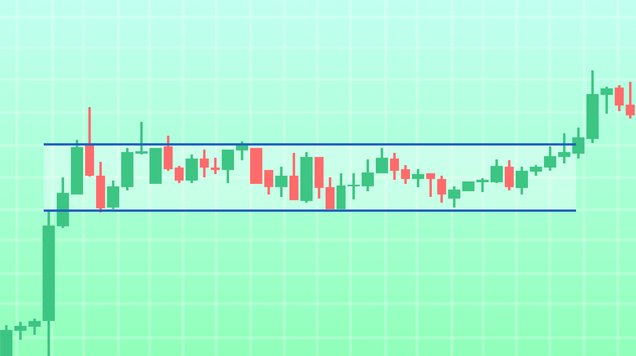
There are three types of trends as markets can move up, down or sideways. In an uptrend, the price of an asset consistently moves in a direction of higher highs and higher lows. In a downtrend, the movement is opposite with both highs and lows getting lower. In a sideways trend, the price of an asset moves within a relatively narrow range without making significant movements up or down.
An uptrend suggests that there is a strong demand for the asset, while a downtrend means there is a strong supply of the asset in the market. A sideways trend indicates there is a balance between buyers and sellers.
Understanding the concept of a trend and being able to identify trends is a fundamental skill for traders of all levels. Many trading strategies are built around capturing the momentum of trends, such as trend-following strategies and momentum strategies.
Traders and investors use various tools and indicators to identify trends, gauge their strength and make informed decisions based on the prevailing trend direction that they have identified.
Introduction to trend trading
Trend trading is a popular trading strategy that is based on identifying the prevailing direction of a market’s movement with the intention of generating profit. Trend traders believe that assets move in consistent directional trends over time.
The idea behind trend trading is to buy when the trend is upward and sell short when the trend is downward, with the expectation that the trend will continue.
Trend trading is a relatively straightforward trading strategy which makes it suitable for traders of all levels of experience.
These are the key steps in trading market trends:
1. Identification of the trend
The first step in trend trading is to recognise the prevailing trend. Traders use technical analysis tools, including trendlines and indicators like Moving Averages and RSI, to determine the direction of the trend and measure its strength.
2. Entry points
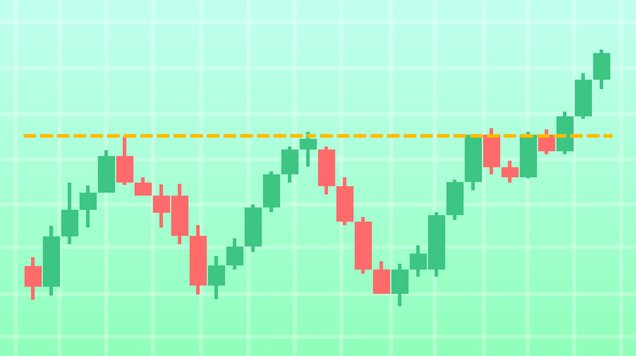
Once you have identified the trend, it’s time to look for an optimal entry point to initiate a trade. This can be done by looking for retracements and pullbacks within the current trend, which is done by looking at support and resistance levels. Before opening a position, confirmation indicators like oscillators can help to verify ideal entry points.
3. Exit strategies
Effective exit strategy plays important role in maximising profits and minimising losses. Take profit orders are a commonly used tool to lock in profits. A take profit order allows traders to decide how much profit they wish to make and set the trade to close automatically when this profit level is reached.
4. Risk management
Like any trading strategy, risk management is essential also in trend trading and risk management tools should be applied to all trades. Setting a stop loss order helps to limit potential losses in case the trend reverses unexpectedly. In trend trading, support and resistance levels often serve as an indicator for stop loss and take profit orders.
Trendlines and technical analysis tools – how to use them in trend trading?
To start trend trading, you need to know how to identify trends. Let’s look at trendlines and other commonly used tools by trend traders.
Trendlines are the most popular charting tool to identify trends. Trendlines are drawn by connecting series of asset’s prices together. To create a trendline, you should have at least two top or bottom prices to connect to each other.
In addition to trendlines, there are other tools and technical indicators traders can use to identify and confirm trends. Moving Averages, Relative Strength Index (RSI) and Average Directional Index (ADX) are some of the commonly used. Using multiple tools and indicators strengthens the confirmation of a trend.
Simple Moving Average (SMA) is an average of prices over a specified time period and can be calculated based on closing, opening, minimum or maximum prices. Exponential Moving Averages (EMA) give more weight to the recent prices, making them more sensitive to short-term price changes.
Relative Strength Index or RSI is a momentum oscillator that measures the speed and significance of the asset’s recent price changes. It has a value between 0-100. A reading below 30 indicates that the asset is oversold, while a reading above 70 indicates that it’s overbought. By analysing the momentum and magnitude of recent price changes, RSI can assist traders in validating trends and predicting trend reversals.
Average Directional Index can be used by trend traders to measure the strength of the trend and help them decide whether it’s the right move to trade it. Like RSI, the ADX also has a value between zero and 100. If the ADX value is under 25, it can indicate a weak trend or even that there is no identifiable trend in the market. When the value is over 25, trend traders believe the trend is clear and strong enough to enter a position. The higher the value, the stronger the trend.
All these tools are usually available on your broker’s online trading platform. On popular trading platforms, like MT5, traders can easily draw trendlines and apply different indicators to their charts. These tools are free to use, and you can practice with a risk-free demo account first if you feel like you need a bit more practice understanding how they work.
Benefits and disadvantages of trend trading
Trend trading offers several benefits and these advantages can make this strategy an appealing approach for experienced pros to beginners learning to navigate financial markets. Yet while trading trends can be profitable, it comes with certain challenges that should be considered as well.
Here are a few key concepts to keep in mind whilst trend trading:
Simplicity: The core concept of trend trading is relatively simple: identify the current trend and trade in the same direction. This simplicity makes the strategy accessible to traders of varying experience levels.
Clear entry and exit points: With the help of technical analysis tools, the identification of the entry and exit points for a trade is quite straightforward which helps traders to make more disciplined decisions and reduce the impact of emotions.
Suitable for different markets: Trend trading can be applied to a variety of asset classes, including shares, commodities, indices, and currencies. This makes it easy for traders to diversify their portfolio without having to change trading strategy.
Compatible with different trading goals: Trend trading is a useful strategy for traders focusing on short-term profits, but it can be applied to longer-term financial goals too.
Lack of a trend: Sometimes markets don’t have a clear trend, and the price movement is more sideways than up or down. In these moments, traders might want to choose a trading strategy that is more suitable such as the range bound trading strategy.
False signals and whipsaws: Despite the apparent simplicity of trend trading, there are a few unpredictable scenarios that may occur. False signals are price movements that lead to traders to predict the future market movements incorrectly. Entering or exiting the market due to a false signal can lead to losses and traders are encouraged to use confirmation tools to avoid premature entries or exits. Whipsaws refer to sudden and unpredictable changes in the asset’s price and can cause false signals.
Trend reversals: Trends won’t last indefinitely, meaning that at some point the trend will reverse or change. Sometimes trend reversals can be unexpected and strong, leading to potentially large losses if trades are left unmonitored or risk management hasn’t been applied correctly.
Missed entry or exit points: One of the risks in trend trading is entering the market too late or exiting it too early to fully profit from the trend. It’s important to combine several tools and indicators to predict the price movements and keep monitoring your positions to adjust them to changing situations.
It’s important to remember that no strategy guarantees profits and traders should always apply suitable risk management strategies to their trades to protect their capital and limit losses. If it’s your first time using this approach, its helpful to practice your trend strategies on a trading demo with virtual funds before placing any capital at risk.

